Sample Data Science Scholars Research Projects
Summer 2024 Research Presentations
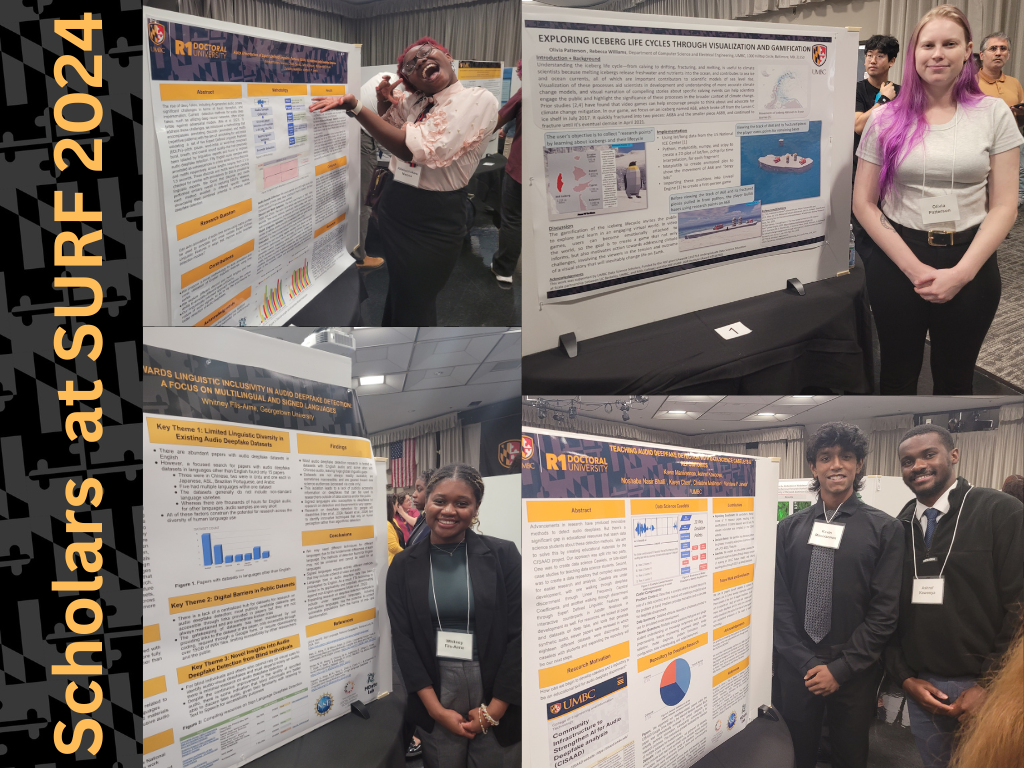
Data scholars and REU scholars shared their research on August 8, 2024.
Scholars had the opportunity to participate in UMBC’s SURF (Summer Undergraduate Research Festival) 2024 on Wednesday, August 7, 2024.
Fall 2022 & Spring 2023 (Nehal Naqvi, Chi-Chi Onyekonwu, Sunny Balani)
This semester, a few data science scholars explored identification methods for audio deep fakes, which are audio clips created to imitate the speech of individuals through audio manipulation. Scholars have examined visual features within audio spectrograms and matrix profiles to explore how anomalies and deviations are presented visually and indicate the presence of a deepfake.
Spring 2023 (Gehan Boteju)
Gehan studied the Effects of slash-and-burn agriculture Practices in the Amazon on Antarctic Ice Sheets in 2019. Aerosols can darken the ice surface or reduce albedo (reflectivity of sunlight). This leads to more absorption of solar energy. As a result, snow temperature increases, leading to higher melting and snow/ice mass loss. This exploratory analysis is a first step toward understanding the causal relationship between aerosols from forest wildfire and ice/snow melting processes.
Spring 2022
Sam Geverdt worked with Dr. Dillon Mamhoudi to do research on Census Data because we believed there were major errors in how they went about counting populations across the nation. This hypothesis was born from a research study done by several journalists in Detroit where they discovered the Census Bureau had massively undercounted minority populations, specifically black communities. With the loss of these counts, ethnic groups in Detroit missed out on millions of dollars of federal grants, funding, and resource assistance. We wanted to see if the same problem was happening in Baltimore and if there was anything that could be done.
With the 2020 Census data being recently released we decided to break it down and analyze in a visual way using ARCGIS and QGIS both data analysis and visualization software. We took raw data from the census and turned it into shapefiles and tables we could work with using Python and R and then used the ARC and Q to create random point maps based on the data we created to represent different ethnicities presences in the city over time. We had a control set of data from the ACS 5 year survey that has tended to report more accurately due to the noninvasive nature of its questions which we compared census data against.
The results were as we expected. While populations across the board did come back undercounted, it was far heavier in black and other minority populations to see reduced numbers. The extent of this undercount could be even more severe than the numbers show, due to the fact that many can report without specifying their race or lying to protect themselves or their families. The census needs to produce a more inclusive way of recording populations because if they continue to marginalize and under-count, necessary funds are lost to populations that desperately need them.
Link to Presentation: https://docs.google.com/document/d/1ofNKh8K6qrKJlc0NxxdppAWTkZHrkJUm/edit?usp=sharing&ouid=113915535672985227682&rtpof=true&sd=true
Abbey Cotton worked with UMBC faculty Dr. Brain Soller (Sociology, Anthropology, and Public Health) to develop an application that uses course enrollment data to determine which sections would be best online during an outbreak. Instructors and administrators can use it to visualize section networks and see how an individual section impacts the wider university. Abbey researched social networks, the impact of COVID and remote learning on college students, and how contagious diseases spread throughout networks. After that she began brainstorming and planning out the app. The web app, which will hopefully be hosted on campus, has two different types of users. Administrators will have access to the entire section network and be able to do things like search for sections based on some attribute. Instructors will only have the data that relates directly to their sections. After being logged in, they are sent to their respective home page. “My Sections” is available to instructors and displays a table of their sections along with a couple plotly graphs. The admin page currently shows a table of sections ranked by betweenness centrality, a pie chart on the instruction modes of sections, and histograms on the number of degrees and betweenness centrality. Users can click on each of the table rows which redirects them to the section page. The app’s main feature is an interactive network graph of all sections in the database. Administrators can see the whole thing while instructors are limited to their neighboring sections. Each section page also has its own network. The user can change the graph’s layout, filter by edge weight (the number of students that two sections share), zoom in and out, and hide online classes.
Link to design document
Khalyl Konkobo worked with a faculty member from the information systems department Dr. Karen Chen on a learning analytics project to explore gateway course failures and major switch patterns with students who intended to major in computer science at UMBC. This project uses a deidentified dataset of 13,550 students from the Fall 2015 to Spring 2019 cohort which includes students’ per-semester major plan, course enrollment, and performance, as well as students’ demographics information such as race, gender, and information collected upon UMBC matriculation such as high school GPA as well math placement outcomes. Gateway courses are critical milestones that students need to pass in order to proceed with planned majors. Failing gateway courses and the subsequent major switch is one of the early “shocks” that students have to grapple with. These negative experiences could have a profound impact on students’ self-efficacy, academic trajectory, and career outcomes. Data available provides rich opportunities for examining the related educational process and student outcomes from multiple perspectives including learning, teaching, and program design point of view. As one of the initial steps in this exploration, we compare and contrast students who failed computer science gateway courses and those who did not, and explored predictive models for the early identification of students who are likely to fail gateways courses. We explore how those insights may open avenues for a holistic learning analytics-guided inquiry in order to gain insights to support department and program-level decisions and student advising. This work was presented on May 11 at the 2022 Annual International Learning Analytics Summit hosted by Indiana University’s Center for Learning Analytics and Student Success. According to the Summit organizer, Khalyl is the first undergraduate student who presented at the Summit.
Link to presentation
Citation:
Konkobo K, Chen, LK, Bumpy journeys: exploring gateway failures and major switches. Annual International Learning Analytics Summit, Indian University, May 2022
David Wang worked with Information System Faculty Dr. Karen Chen, is part of a team representing the University of the West Indies Five Islands Campus and the University of Maryland, Baltimore County was awarded second place in the Climate Data Challenge and presented at the Global Resilience Dialogue 2022 conference in April 2022. The proposed solution assesses tourism sustainability in the Eastern Caribbean from the perspective of Polar Region Ice Melting to Sea Level Change and extreme weather events such as rainfall. David’s contribution is data visualization with the sea-level change data for the Eastern Caribbean Regions. This project is in partnership with iHARP project.
Citation:
Ildephonce I, Chen LK, Wang D, Bertrand F, Asonganyi E, Towards Usable Science
for Assessing Tourism Sustainability in Eastern Caribbean: From Polar Region Ice Melting to Sea Level Change to Rainfall, Data Challenge at Global Resilience Dialogue 2022, March 2022